Computing and visualising sustainable material demand projections
I'm happy to announce the completion of the mat-dp-pipeline project! As part of the MAT-DP project, we developed a data processing pipeline and visualisation that displays material demand. The idea is that this pipeline has the capacity to receive a variety of different input structures and types, then convert them in the same consistent format. Once this conversion has taken place, the data can be processed and plotted on graphs.
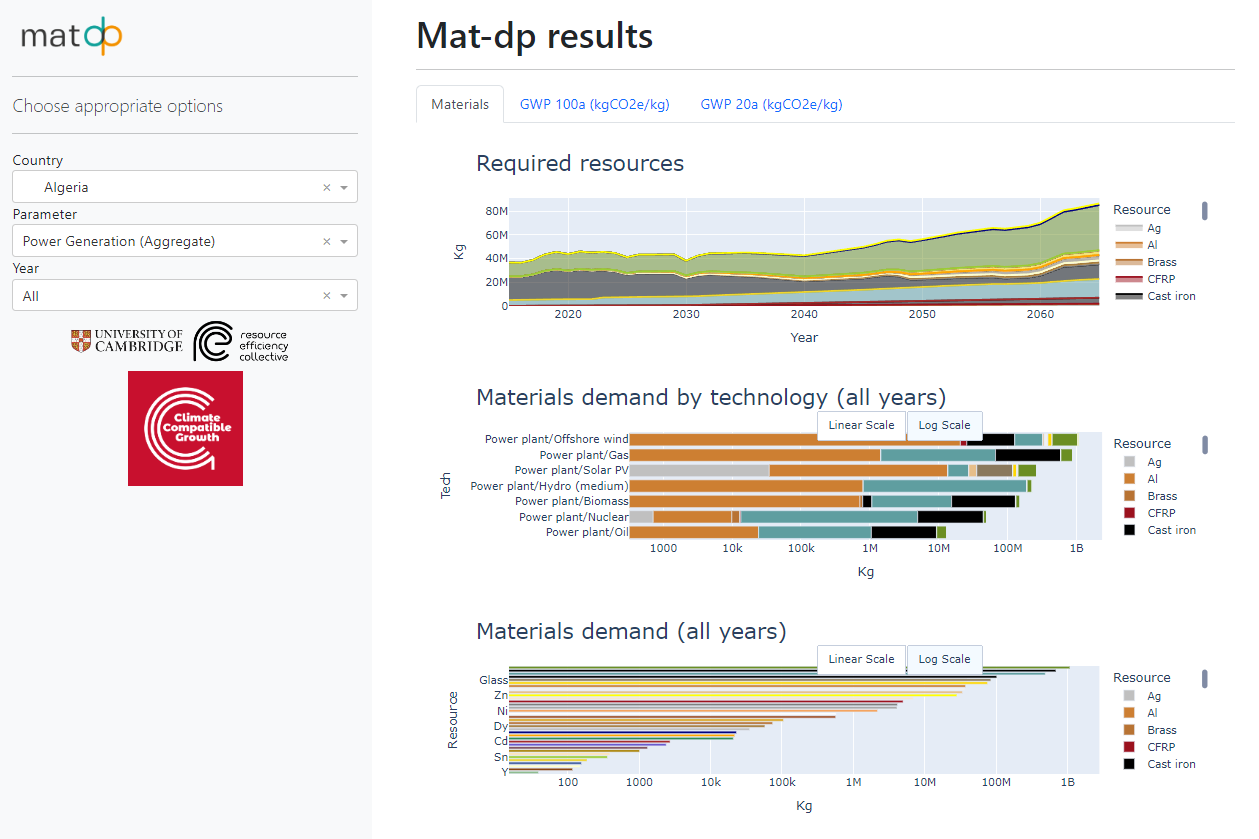
A small demonstration of the app can be seen below:
Links
For the github repository, see here: